Vibroseis
June 5, 2010 Leave a comment

 The Fourier transform
I’m going to learn you something about why and how the Fourier transform is used. The geophysical industry is involved, paradoxically, in mapping the physics of geology. IE layers in the crust of the earth. Do not try to understand this, just know it. Keep in mind that this is what they THINK they are doing only.
Time/Freq <—–This is the input in the frequency domain (perception, right mind) This is almost real.
This is the interpretation of the frequency domain. (Time domain, sound, left mind) This is kinda real
These pictures show a land crew setup. In both cases a sound source (thumper on land) tagged with a one, transmits a sound into the earth. This sound travels into the earth and the reflections are picked up by the geophones (microphones) tagged with a 2. Although these GIF’s are over simplified we are going to make it simpler. Just keep in mind there are millions of data points PER SHOT. The amount of data is staggering. (one data point every 4 milliseconds) It would be virtually impossible to calculate this in the time domain. We’ll break it down in to one thump and one data point. Ideally the signal received by the geophones would look like this;
 BUT this would assume an amorphous earth, which means no oil, which means no cars, which means horse and buggy time. But the substrata is layered and the original sine wave is distorted when it passes through a strata. This distortion is what they’re looking for, by using the Fourier transform;
 ![]() They can transform it into the frequency domain and back. Actually the integral from infinity to infinity is still impossible, in practice they’ll knock it back to about -8 to +8. As you can see you’ll still be knee deep in shit quickly with a calculator. But here come the “raster box” the MCX (MiCro Xformer), ATP (Array Transform Processor) or any of dozens of hardware configurations capable of transforming a whole array at once. (Oh, I didn’t mention that slight detail, not very important but worth mentioning if you’re going to use a calculator. (you might miss dinner))
They can transform it into the frequency domain and back. Actually the integral from infinity to infinity is still impossible, in practice they’ll knock it back to about -8 to +8. As you can see you’ll still be knee deep in shit quickly with a calculator. But here come the “raster box” the MCX (MiCro Xformer), ATP (Array Transform Processor) or any of dozens of hardware configurations capable of transforming a whole array at once. (Oh, I didn’t mention that slight detail, not very important but worth mentioning if you’re going to use a calculator. (you might miss dinner))

 <——This is the quantification of the interpretation of the perception (Wave Form, Computer).
It ain’t real!!! It’s a friggin piece of paper that describes reality. It’s a rubber ruler. It’s not even in your head, it’s in the friggin computer.
We’re dealing with signal to noise ratios of 1 to 10,000 IE one part signal to 10,000 parts noise. Click on the image to the left and notice the big wave at the top. That’s called the ground wave, the sound transmitted directly to the geophones. That’s not what we’re interested in. We’re interested in the little squiggles further down. (After all we already know what’s on top of the ground). Not to mention the refractions. These signals are flectorizing all over the place. Oh yeah, they’re interactive so you have to do a whole array at once. IE keep them and their interactions in your head at one time) Do not try to remember this, I am just trying to impress you with the enormity of the problem. But the raster box makes it all better. You just feed in the data and the answer pops out. Also I would like to impress upon you the importance of the Fourier transform. Without it an industrial society could not exist.
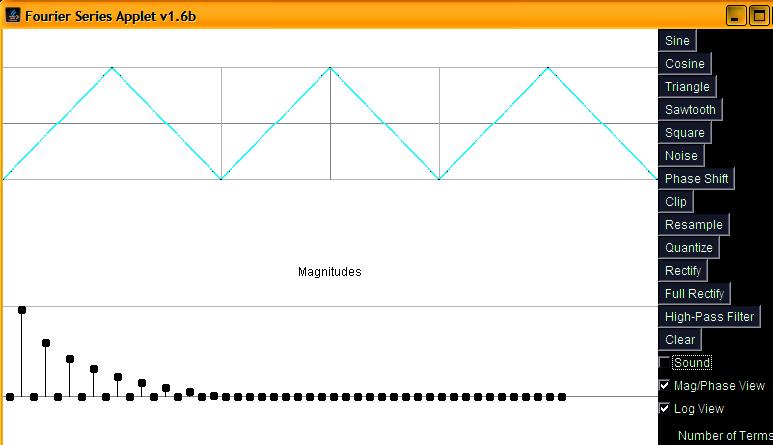
But ALL of these problems go away in the frequency domain. The top graph shows a triangle wave in the time domain. (cyan) This is in fact a sine wave distorted by additional frequencies. It would be impossible to figure out these distorting frequencies in the time domain.
However if we convert the above graph into the frequency domain the signals pop out. (actually it’s only a quasi frequency domain graph, to be accurate you’d need to use polar coordinates) Note that the data points are one octave apart. Also that the horizontal axis is vector not time. The data points that are not zero are what we refer to as the musical scale. Do, re, mi, fa, so, la, ti, do. To interpret this think of the first data point as when the vector arrow is perpendicular. At this point the second vector is at the indicated position IE one octave down. If we rotated the disk so that the second vector was maximum the first vector would be one octave down. This would seem to indicate that we evolved to interpret sound as a triangle wave. But that’s another paper. That program I put on the stick translates from the time domain and back real time and interactively. Play with it and watch how the mind interprets sound in the time and frequency domain.


